上QQ阅读APP看书,第一时间看更新
Viewing Matplotlib plots
For static figures, type %matplotlib inline in a cell. The figure will be displayed in the output area:

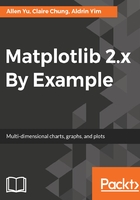
Running %matplotlib notebook will embed the Matplotlib interface in the output area.
Real-time interaction such as zooming and panning can be done under this mode. Clicking on the power sign button in the top-right corner will stop the interactive mode. The figure will become static, as in the case of %matplotlib inline:
